Observability on a Budget: Tools for Small Teams Running Production Systems
ALT: Small engineering team reviewing production system observability dashboards and budget monitoring tools
Choosing the Right Observability Stack When Resources Are Limited
For small engineering teams running production systems, the question is rarely "should we have observability?" — it is "which tools can we actually afford and operate without a dedicated platform team?" Observability is the practice of understanding a system's internal state by examining its external outputs — metrics, logs, and traces — and it is a non-negotiable requirement for any service that real users depend on. The challenge is that the observability tooling market has historically been dominated by enterprise-grade platforms priced to match, leaving lean teams to either over-spend, under-invest, or piece together open-source components without a clear framework.
This article compares three widely-used approaches to production observability for small teams: managed SaaS platforms (exemplified by tools like Grafana Cloud and New Relic's free tier), self-hosted open-source stacks (exemplified by the Prometheus and Grafana combination), and lightweight all-in-one agents (exemplified by tools like Datadog's cost-managed tier and OpenTelemetry-native collectors). The criteria used to judge each approach are cost at small-team scale, operational overhead, breadth of signal coverage, ease of onboarding, and alerting capability.
Evaluation Criteria: What Matters Most for Budget-Conscious Production Teams
Selecting an observability solution without a clear evaluation framework is how teams end up locked into expensive contracts or buried in infrastructure maintenance they did not budget for. The following five dimensions define what "good" looks like for a small team keeping a production system alive.
Cost at small-team scale is the primary filter. Many enterprise platforms appear inexpensive at signup and become materially costly as data volume grows. According to the pricing analysis published by Acceldata, data observability tool costs scale in ways that are not always obvious from headline pricing, with ingestion volume, retention period, and seat count each acting as independent multipliers. Teams need to model their likely data footprint before committing.
Operational overhead measures how much engineering time the tool itself consumes. A self-hosted stack requires provisioning, upgrades, storage management, and on-call coverage for the observability infrastructure — effort that directly competes with product work. For a two- to five-person engineering team, this trade-off is existential.
Breadth of signal coverage refers to how comprehensively a tool covers the three pillars of observability: metrics (numeric time-series data), logs (structured or unstructured event records), and distributed traces (request-level spans across services). As noted by New Relic in their overview of observability principles, full-stack visibility requires all three signal types working in concert — point solutions that cover only one pillar force teams to operate multiple tools and correlate data manually.
Ease of onboarding determines how quickly a new engineer — or a founder wearing an engineering hat — can go from zero to actionable dashboards. Steep configuration curves delay time-to-insight and create single-person knowledge dependencies that are dangerous in small teams.
Alerting capability is what transforms passive monitoring into active incident response. An observability tool that cannot reliably page the right person when a production threshold is breached is a dashboard, not a safety net.
The Contenders: Three Approaches to Lean Production Observability
Managed SaaS Platforms: Grafana Cloud and New Relic Free Tiers
Managed SaaS observability platforms are cloud-hosted services that handle all infrastructure, storage, and scaling concerns on behalf of the user. Grafana Cloud is the hosted version of the widely-adopted Grafana visualization platform, offering managed Prometheus metrics, Loki log aggregation, and Tempo distributed tracing under a single umbrella. New Relic is a full-stack observability platform that provides application performance monitoring, infrastructure metrics, log management, and distributed tracing, with a free tier structured around a generous data ingest allowance per month.
Both services allow a team to instrument their application once — typically via an OpenTelemetry SDK or a language-specific agent — and immediately begin querying all three signal types through a hosted UI. The operational overhead is near-zero: no servers to manage, no storage to provision, no upgrade cycles to plan. The cost model on free and entry tiers is genuinely workable for teams with moderate data volumes, though costs rise predictably as ingest grows. A pattern consistently seen in early-stage product teams is that SaaS platforms dramatically compress the time between "we have a problem" and "we understand the problem," particularly when the team has no prior observability experience.
Self-Hosted Open-Source: Prometheus + Grafana Stack
The Prometheus and Grafana combination is the canonical open-source observability stack for infrastructure-level metrics and dashboards. Prometheus is a time-series database and scraping engine, maintained under the Cloud Native Computing Foundation (CNCF), that collects metrics by polling instrumented endpoints. Grafana is an open-source visualization platform that connects to Prometheus (and dozens of other data sources) to render dashboards and configure alerts.
This stack is genuinely free in software licensing terms. The real cost is operational: someone must deploy, configure, and maintain Prometheus, manage its storage, and ensure Grafana's alert notification pipelines remain functional. For teams with a dedicated infrastructure engineer or strong DevOps experience, this is a reasonable investment that yields deep control and zero vendor dependency. For teams where every engineer is also shipping product features, the maintenance burden can outweigh the licensing savings. Notably, logs and distributed traces require additional components — Loki for logs and Tempo or Jaeger for traces — making a truly full-stack self-hosted setup meaningfully more complex.
Lightweight OpenTelemetry-Native Collectors with Cost-Managed Commercial Tiers
OpenTelemetry is an open-source observability framework and collection of APIs, SDKs, and tools, governed by the CNCF, that provides a vendor-neutral standard for generating and exporting metrics, logs, and traces. Pairing an OpenTelemetry Collector with a cost-managed commercial backend — such as Datadog's usage-capped configuration, Honeycomb's free tier, or Signoz (a fully open-source, self-hosted alternative with a native UI) — represents a middle path between full SaaS convenience and full open-source control.
The key advantage of leading with OpenTelemetry instrumentation is portability: because the instrumentation layer is vendor-neutral, a team can switch backends without re-instrumenting their application. This is a material risk hedge for teams that are uncertain about their long-term data volume or budget trajectory. As highlighted in the observability tool landscape analysis published by FuturePicker, OpenTelemetry-native pipelines are increasingly the default choice for teams building new systems, precisely because they decouple the instrumentation investment from any single vendor's pricing decisions.
ALT: Side-by-side comparison diagram of managed SaaS, self-hosted Prometheus Grafana, and OpenTelemetry observability stacks for small production teams on a budget
Head-to-Head Comparison: Budget Observability Stacks Evaluated
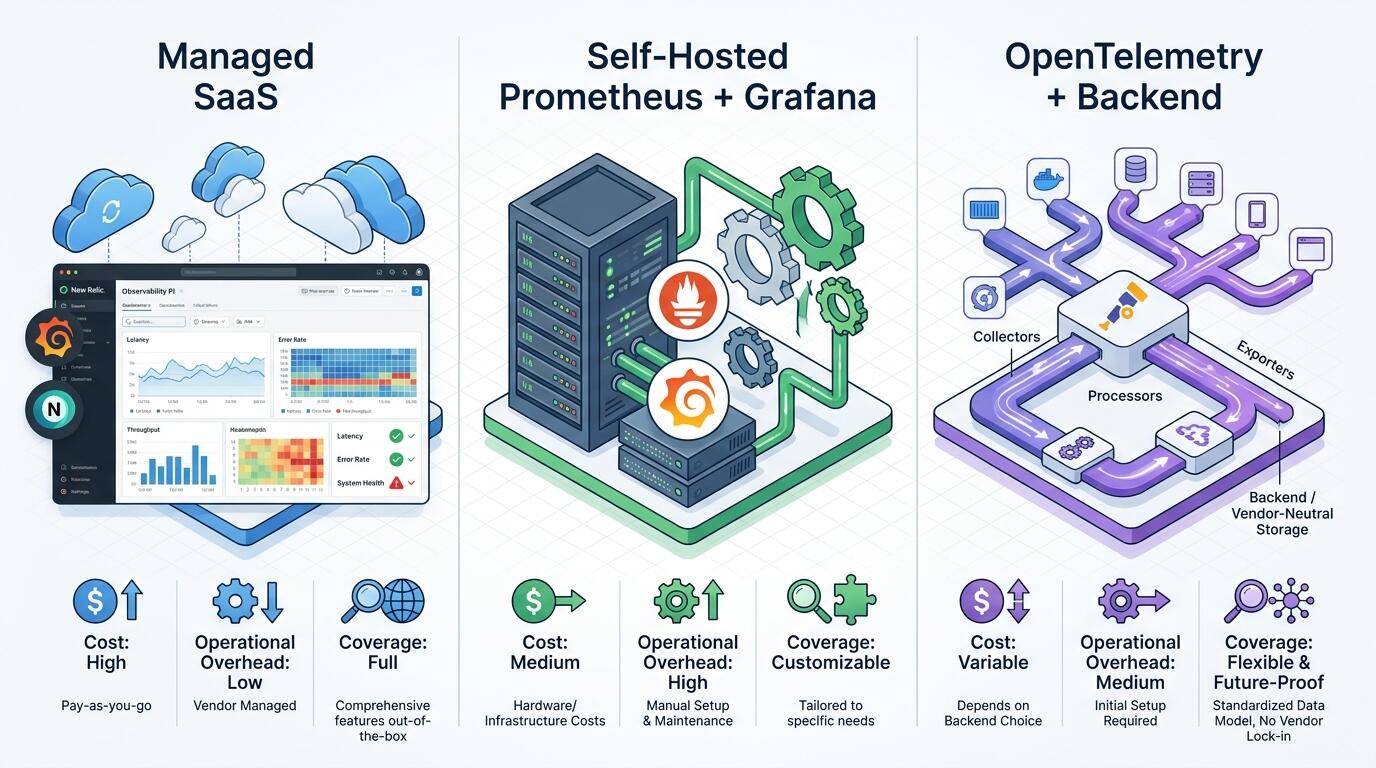
| Criterion | Managed SaaS (Grafana Cloud / New Relic) | Self-Hosted Prometheus + Grafana | OpenTelemetry + Cost-Managed Backend |
|---|---|---|---|
| Cost at Small Scale | Free tiers available; costs scale with ingest volume | Free (software); compute and storage costs apply | Free-to-low; backend tier determines cost ceiling |
| Operational Overhead | Very low — vendor-managed infrastructure | High — team owns provisioning, upgrades, storage | Low-to-medium — collector config required, backend managed |
| Metrics Coverage | Full | Full | Full (vendor-neutral) |
| Log Coverage | Full (Loki integrated) | Requires Loki add-on | Depends on backend; generally full |
| Distributed Tracing | Full (Tempo integrated) | Requires Tempo or Jaeger add-on | Full — OTel traces natively supported |
| Ease of Onboarding | High — guided setup, hosted UI | Low-to-medium — significant configuration required | Medium — collector setup has a learning curve |
| Alerting Capability | Strong — built-in alerting and notification routing | Strong once configured — AlertManager required | Depends on backend; generally strong |
| Vendor Lock-in Risk | Medium — data and dashboards are vendor-specific | None — fully self-controlled | Low — instrumentation is portable |
| Recommended Team Profile | Non-infra-heavy teams, fast movers | Teams with infra expertise and time | Teams planning for scale or backend flexibility |
The most significant differentiator across these three approaches is not cost in isolation — it is the relationship between cost and the time investment required to realize value. Managed SaaS platforms front-load value delivery: within hours of signup, a team can have production dashboards running. The trade-off is that costs are harder to control as a product grows, and some platforms impose data retention limits on lower tiers that can be problematic for post-incident retrospectives.
The self-hosted Prometheus and Grafana stack inverts this trade-off entirely. The upfront configuration investment is substantial, and the ongoing maintenance burden is real — particularly for teams operating in cloud environments where storage and compute carry direct costs. In practice, the "free" label attached to open-source observability is accurate only for the software license; the total cost of ownership, once engineering time is factored in, can exceed a mid-tier SaaS subscription for a small team.
The OpenTelemetry-native approach occupies a pragmatic middle ground that is increasingly well-supported by the ecosystem. Because the CNCF's OpenTelemetry project defines a vendor-neutral wire format and SDK, teams that instrument their services with OpenTelemetry today preserve the option to migrate backends later — a flexibility that has real financial value if a team's data volume grows unexpectedly. For teams approaching AI system design on a lean budget, this portability is particularly relevant because AI workloads generate high volumes of inference-time telemetry that can spike ingestion costs unpredictably.
Which Should You Choose? Scenario-Based Recommendations
Choosing the right observability approach depends less on which tool has the most features and more on the actual constraints and capabilities of the team operating it.
If you are a two- to four-person founding team shipping your first production service, choose a managed SaaS platform — specifically Grafana Cloud or New Relic's free tier. The zero-maintenance overhead and fast time-to-dashboard are worth more to you than the incremental cost savings of self-hosting, and your engineering cycles are better spent on the product. Set up alerting on day one; do not wait for your first outage to realize you have no visibility.
If you have at least one dedicated infrastructure or platform engineer and are running a service with predictable, high-volume telemetry, the self-hosted Prometheus and Grafana stack is worth the investment. You gain full control over data retention, query performance, and cost, and you avoid vendor pricing surprises as your metrics cardinality grows. Budget explicitly for the operational time this requires — it is not zero, and pretending otherwise leads to a brittle, under-maintained observability setup that fails exactly when you need it most.
If you are building a new system from scratch and are uncertain about your long-term data volume or vendor preferences, instrument with OpenTelemetry from the beginning and start with a cost-managed commercial backend. This gives you the fast onboarding benefits of a managed service while preserving the option to self-host or switch backends later. It is the approach we consistently recommend in our work with teams building AI-powered products, where inference telemetry patterns are often unknown at the outset. For teams working through the complexities of building machine learning pipelines that scale past prototype stage, starting with vendor-neutral instrumentation prevents a painful re-instrumentation exercise as the system matures.
Pros and cons summary:
- Managed SaaS: fast onboarding, zero ops overhead, genuine free tiers — but costs scale with volume and data portability is limited.
- Self-hosted Prometheus + Grafana: maximum control and zero licensing cost — but high operational overhead and a steep initial configuration investment.
- OpenTelemetry + cost-managed backend: portable instrumentation and reasonable onboarding speed — but backend selection still requires evaluation, and the collector configuration has a non-trivial learning curve.
Frequently Asked Questions FAQ
Q1: How do small teams keep observability costs from growing out of control as their product scales?
The most effective cost control mechanism is setting explicit data retention policies and sampling strategies before costs become a problem, not after. For distributed traces in particular, full-fidelity collection at high request volumes becomes expensive quickly — head-based or tail-based sampling, where only a representative subset of traces is retained, can reduce storage costs substantially without meaningfully degrading debuggability. According to observability pricing research from Acceldata, ingestion volume, retention period, and seat count are the three primary cost drivers across most commercial platforms, making each a lever for active management.
Q2: Is OpenTelemetry mature enough to use in production today?
OpenTelemetry is production-ready for metrics and traces; its logging specification reached stability more recently and is now broadly supported across major backends and language SDKs. The CNCF, which governs the OpenTelemetry project, has classified its tracing and metrics APIs as stable, and major cloud providers — including AWS, Google Cloud, and Azure — natively support OpenTelemetry ingestion. For new production systems, instrumenting with OpenTelemetry is the recommended default, as it avoids vendor lock-in and is increasingly the standard the ecosystem is converging on.
Q3: How long does it typically take to get meaningful observability in place for a small team starting from scratch?
A managed SaaS platform with a pre-built integration for your framework (e.g., Node.js, Python, Go) can deliver basic metrics, logs, and alerting within a single working day for a straightforward service. A full self-hosted Prometheus and Grafana setup, including alert routing via AlertManager and log aggregation via Loki, realistically takes several days to a week to configure properly. The OpenTelemetry collector approach sits between these extremes. In all cases, the first priority should be getting alerts on the two or three metrics that directly indicate user-facing failure — latency, error rate, and availability — before optimizing the completeness of the observability setup.
Final Thoughts
Observability for small teams is not about achieving the most comprehensive telemetry setup possible — it is about achieving enough visibility to detect, diagnose, and resolve production failures before they become user-impacting disasters, within the budget and operational capacity the team actually has.
Key Takeaways:
- Managed SaaS platforms are the right starting point for most small teams; the zero-ops overhead compounds in value when engineering headcount is limited.
- Self-hosted stacks are genuinely cost-effective only when the team has dedicated infrastructure expertise and the operational time to apply it.
- OpenTelemetry-native instrumentation is the safest long-term bet for new systems, because it decouples your observability investment from any single vendor's pricing trajectory.
- Alerting on a small number of high-signal metrics — error rate, latency, and availability — delivers more practical safety than comprehensive dashboards no one looks at.
- Cost control in observability is an active practice, not a set-and-forget configuration; revisit retention policies and sampling rates as your data volume evolves.
The next step is concrete: pick one approach from the options above that matches your team's current constraints, instrument one service end-to-end with all three signal types — metrics, logs, and traces — and set up at least one production alert before the end of the week. Observability that ships later is worth less than observability that exists now.
Ready to architect a production system with observability built in from the ground up? Explore technical insights, systems design guidance, and real shipped projects at Darius — built for founders and engineers who need pragmatic, senior-level thinking on complex engineering problems.
Sources & Further Reading
- FuturePicker. "Best Observability Tools for Small Teams in 2026 (Budget ...)".
https://futurepicker.com/en/observability-tools-small-teams-2026-2/ - New Relic. "What is Observability: Benefits & Use Cases".
https://newrelic.com/blog/observability/what-is-observability - Acceldata. "Understanding the Pricing of Data Observability Tools".
https://www.acceldata.io/blog/data-observability-tool-pricing-complete-breakdown-cost-guide - Cloud Native Computing Foundation (CNCF). OpenTelemetry Project and Observability Standards.
https://www.cncf.io/
Note: Standards and tool capabilities may be updated; please check the latest official documentation or consult professional advisors before making tooling decisions.