Observability on a Budget: What Small Teams Should Track First This Quarter

ALT: Small engineering team reviewing observability dashboards on a budget to track system health
Why Observability on a Budget Is the Right Conversation to Have Right Now
Key Conclusion: Small teams spending engineering hours on comprehensive observability tooling before they understand what actually matters are burning money and attention they cannot afford. Observability on a budget is not about cutting corners — it is about being deliberate: identifying the highest-signal metrics first, building only the instrumentation that directly informs product and operational decisions, and growing the monitoring stack in proportion with actual system complexity and revenue.
Observability has quietly become one of the fastest-growing line items in engineering budgets — even at organizations still operating at seed or Series A scale. According to LogicMonitor, observability budgets are expanding even when broader IT spending is under pressure, which signals that teams recognize its strategic importance. The challenge is that most small teams approach the problem the wrong way: they adopt enterprise-grade tooling, instrument everything, and drown in dashboards before they have shipped enough product to know what they actually need to watch. This quarter is a good moment to reset that thinking.
The Current State of Engineering Observability and How It Got Here
Observability is a property of a system that describes how well its internal state can be inferred from external outputs — primarily logs, metrics, and traces, which together form what practitioners commonly call "the three pillars of observability." The term has expanded in industry usage to encompass alerting, dashboards, error tracking, user session replay, and increasingly, AI-driven anomaly detection. The practical meaning for a small team is simpler: can you tell, right now, whether your system is working well enough — and if not, can you figure out why without a multi-hour investigation?
The observability industry grew out of the rise of distributed systems and microservices. When a monolith breaks, the cause is usually apparent; when a distributed system degrades, the failure can be buried across dozens of services, queues, and third-party dependencies. Large companies built extensive internal tooling to address this, and the commercial ecosystem followed. Tools like Datadog, New Relic, Dynatrace, and Honeycomb emerged to make those capabilities accessible without hiring a platform engineering team of ten. The result has been genuinely useful, but also genuinely expensive — and the pricing models often scale in ways that punish small teams with high-traffic or high-cardinality data.
A pattern that consistently appears in early-stage engineering organizations is the "observability sprawl" problem: teams onboard multiple tools during early sprints, each engineer adds instrumentation that feels locally important, and within two quarters the team is paying for four overlapping products, maintaining dashboards nobody reads, and still missing the alert that would have caught the incident that cost them a major customer. According to Honeycomb's writing on observability costs, many teams spend significant portions of their tooling budget on data they never actually query. The economics are clear: unstructured observability investment produces diminishing returns quickly.
The shift toward cloud-native and AI-powered products has compounded the problem. Systems now include not just traditional web services but model inference endpoints, embedding pipelines, vector store queries, and asynchronous AI workflows — each with distinct failure modes and cost profiles. Small teams building in this environment need to think carefully about which signals are diagnostic (they tell you what is wrong) versus cosmetic (they tell you something is happening but rarely change what you do).
The current moment is also shaped by a maturing open-source ecosystem. Projects under the Cloud Native Computing Foundation — particularly OpenTelemetry — have standardized how instrumentation is defined and collected, reducing vendor lock-in and making it feasible to start with structured, portable telemetry from day one. This means a small team today has genuine infrastructure options that did not exist even a few years ago.
The Mechanism: Why Small Teams Over-Instrument and Under-Observe
Small teams systematically invest in the wrong observability work for three interconnected reasons: they imitate enterprise patterns at the wrong stage, they optimize for coverage instead of decision-making, and they underestimate the operational cost of the tooling itself.
Imitating Enterprise Patterns at the Wrong Stage
Enterprise observability strategies are designed for organizations with thousands of services, multiple reliability engineers, and SLA commitments to large customers. When a startup or a small product team copies that architecture — full distributed tracing across every service, custom dashboards for each microservice, per-endpoint latency percentile tracking — they inherit the maintenance burden without the supporting team. In practice, this means an engineer spending meaningful time each week managing alerts instead of building product. The signal-to-noise ratio is poor, alert fatigue sets in, and the monitors that matter get ignored alongside the ones that do not.
Optimizing for Coverage Instead of Decision-Making
Alert coverage — having a monitor for every possible failure mode — sounds like responsible engineering. In reality, a monitor only has value if it reliably changes what a team does. A small team should ask one question for every piece of instrumentation: "If this alert fires, do we know exactly what to do, and do we have the capacity to act?" If the answer is uncertain, the metric is premature. Good observability for a small team is not about comprehensive coverage; it is about minimal viable insight — the smallest set of signals that enables confident operational decisions.
Underestimating the Operational Cost of Tooling
Observability tooling carries a secondary cost that is easy to miss: the time required to configure, maintain, and act on it. Log ingestion costs scale with volume. Trace storage costs scale with cardinality and retention period. Custom dashboards require upkeep as the system evolves. Every tool added to the stack is a small but persistent drain on engineering attention. According to research surfaced by FuturePicker on observability tools for small teams, simpler, more opinionated stacks consistently outperform more comprehensive ones for lean organizations, because they lower the cognitive load required to extract actionable information. When thinking about the build-vs-buy decision for AI infrastructure, the same logic applies to observability tooling: buying a simpler opinionated product often beats assembling a custom stack from flexible components when the team is small.
The High-Cost Failure Modes Unique to AI Systems
AI-powered systems introduce failure modes that traditional observability was not designed to catch. A REST API either returns 200 or it does not; an LLM inference endpoint can return 200 with a response that is factually incorrect, contextually irrelevant, or subtly degraded in quality because of upstream data drift. Model observability — tracking inputs, outputs, latency distributions, and error rates at the inference layer — is a distinct discipline from infrastructure monitoring, and most small teams building AI products do not account for it until something goes wrong publicly. The cost of retroactively instrumenting an AI system after a quality incident is substantially higher than building lightweight input/output logging from the start.
Evidence and Trade-offs: Choosing Your First Observability Priorities
The most practical question for a small team entering a new quarter is: given limited budget and engineering hours, what should we instrument first? The answer depends on the system type and the team's primary risk, but a consistent pattern appears across the work done with early-stage product teams.
The hierarchy of what to track first generally follows this logic: track what your users will notice before they tell you, track what costs money when it breaks, and track what is hardest to debug without prior instrumentation.
For most small teams, that translates to:
- Error rates and status codes at the entry point — the API gateway, load balancer, or primary backend service. This is the single highest-value signal for user-facing health.
- Latency at the p95 and p99 percentiles for the core user journey, not for every endpoint. Median latency is often misleading; the slowest requests are where users abandon.
- Dependency health — the status of databases, external APIs, and third-party services your product cannot function without. A majority of production incidents in distributed systems trace back to a dependency, not the application code itself.
- Crash and unhandled exception rates in both backend services and client applications, with enough context (stack trace, recent deployment) to triage quickly.
- Resource saturation signals — CPU, memory, and disk for the critical path services only. Everything else can wait.
For teams building AI-powered systems, add one more: inference endpoint response time and error rate, plus lightweight input/output logging to detect quality regressions. This is a low-cost instrumentation decision that pays dividends early.
The table below contrasts the primary approaches small teams take when deciding how to invest in observability:
| Perspective / Approach | Strengths | Trade-offs | Best Fit |
|---|---|---|---|
| Full-stack commercial platform (Datadog, New Relic) | Comprehensive, low initial setup, excellent dashboards | High cost at scale, vendor lock-in, easy to over-instrument | Teams with dedicated SRE time and larger budgets |
| Opinionated lightweight tools (Grafana + Prometheus, Honeycomb) | Cost-effective, open standards, flexible | Requires more initial configuration, more team ownership | Small teams comfortable with some infrastructure work |
| Cloud-native built-ins (AWS CloudWatch, GCP Cloud Monitoring) | Zero additional vendor, integrated with infrastructure | Limited query power, can become expensive with high cardinality | Teams already committed to a single cloud provider |
| OpenTelemetry + vendor-neutral backend | Portable instrumentation, avoids lock-in | More complex setup, requires engineering investment upfront | Teams planning to grow and wanting future flexibility |
The evidence from working with early-stage product teams consistently points toward one conclusion: start with the built-in cloud provider tooling for infrastructure signals, add a single purpose-built error tracking tool (Sentry is a common entry point), and defer full distributed tracing until the system has enough complexity to make trace data actionable. This combination covers the highest-value signals at the lowest total cost.
Where This Is Heading and What It Means for Your Team This Quarter
The trajectory of observability tooling is moving in a direction that ultimately benefits small teams, even if the current market is noisy. OpenTelemetry, now a graduated Cloud Native Computing Foundation project, is becoming the de facto instrumentation standard. As more vendors adopt it as their ingest format, the risk of vendor lock-in decreases — which means teams can instrument once, route data to a cost-effective backend, and switch vendors later without re-instrumenting their codebase. That is a meaningful shift in the economics of early-stage observability investment.
AI-native observability is also emerging as a distinct category. As more products are built on top of language models, retrieval-augmented generation pipelines, and autonomous agents, the need to monitor model behavior — not just infrastructure health — is growing. Teams that build good input/output logging habits early will be positioned to evolve into more sophisticated model monitoring without architectural rewrites. If you are designing an AI system and want to understand how observability fits into a broader architecture conversation, understanding what an AI architecture engagement actually covers is a useful starting point for framing those priorities.
The practical implication for this quarter is straightforward: do not treat observability as a project to complete. Treat it as a practice to establish. Pick the two or three signals with the highest decision-making value for your current system complexity, instrument them well, make sure alerts are actionable and routed to someone who can act, and review them in your weekly engineering rhythm. When you add a new service or a new AI component, extend the practice before that service reaches production — not after the first incident. Shipping fast without losing system visibility is achievable, but it requires intentional choices from the start. The principles in shipping quickly without sacrificing product quality apply directly here: quality and speed are not in tension when you have the right signals in place.
The budget framing matters too. Observability cost is not a fixed line item — it scales with data volume, cardinality, and retention. The teams that manage observability costs well are the ones that make deliberate choices about what data to generate, not just what data to store. Sampling strategies for traces, log level discipline in production, and short retention windows for high-cardinality data are operational habits that compound into meaningful savings at scale.
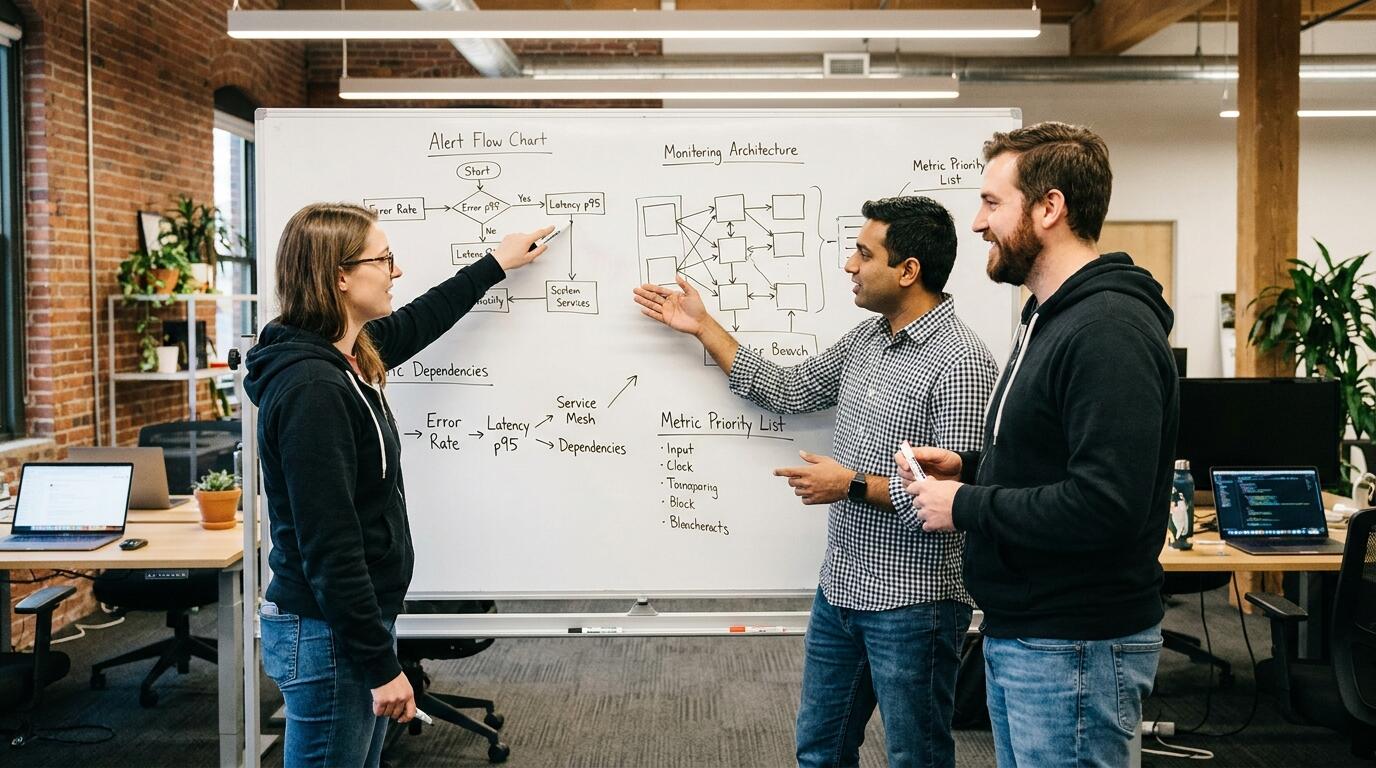
ALT: Small engineering team whiteboarding their observability strategy for budget-conscious system monitoring and alerting
People Also Ask
Q1: How should a small team decide which metrics to monitor first?
Small teams should prioritize metrics that directly reflect user experience and operational cost — specifically, entry-point error rates, latency at high percentiles (p95, p99), and the health of critical dependencies. The decision filter is straightforward: if a metric change would cause the team to take immediate action, it belongs in the first tier. If it would only prompt further investigation rather than direct response, it can wait until system complexity justifies it. Start narrow, instrument well, and expand deliberately.
Q2: Is OpenTelemetry worth adopting for a team with limited engineering bandwidth?
OpenTelemetry is worth adopting even for small teams, primarily because it eliminates vendor lock-in at the instrumentation layer — meaning the cost of switching observability backends later drops significantly. The initial setup requires more effort than dropping in a proprietary SDK, but the long-term flexibility and the growing ecosystem of compatible backends make it a sound investment. Teams with very limited bandwidth can start with auto-instrumentation libraries, which provide reasonable coverage with minimal configuration.
Q3: How much should a small team budget for observability tooling this quarter?
Observability tool spending should scale with system complexity and revenue risk, not with what enterprise teams spend. Many small teams find that a combination of cloud provider built-in monitoring, a lightweight error tracking tool, and selective use of an open-source metrics stack covers their highest-priority signals at a cost that is modest relative to other infrastructure line items. According to Honeycomb's analysis of observability costs, the most important discipline is not finding the cheapest tool but avoiding paying for data volume that is never queried — which means sampling, log level discipline, and short retention windows matter as much as vendor selection.
Summary
Small teams do not need comprehensive observability — they need the right observability at the right stage. Shipping a full enterprise monitoring stack before you understand your system's actual failure modes is a cost that compounds: in tooling fees, in engineering hours, and in alert fatigue that causes teams to ignore the signals that matter.
Key Takeaways:
- Track error rates and latency on the critical user path first — these are the signals users feel before they report them.
- Monitor dependency health (databases, external APIs) explicitly, since most production incidents originate there.
- For AI-powered systems, add lightweight inference logging from day one — model quality regressions are invisible to infrastructure monitors.
- Adopt OpenTelemetry instrumentation early to preserve vendor flexibility as the team and system grow.
- Manage observability costs actively through sampling, log level discipline, and short retention windows — the cost is in data volume, not just tool selection.
The practical next step this quarter is to audit your current monitoring stack: list every tool you are paying for, identify which alerts have actually changed an operational decision in the past 60 days, and cut or consolidate what has not. Then instrument the gaps in your critical path with the simplest tooling that gives you actionable signal.
If you are building an AI-powered or full-stack product and want to ensure observability is designed into the system architecture from the ground up — not bolted on after the first incident — visit the Darius website to explore how a practitioner-first approach to engineering design can help your team ship with confidence.
Sources & Citations
- LogicMonitor. "Why Observability Budgets Keep Growing Even When IT Is...".
https://www.logicmonitor.com/blog/observability-budget-trends - Honeycomb. "Observability Costs: How Much Should I Spend On...".
https://www.honeycomb.io/blog/how-much-should-i-spend-on-observability-pt1 - FuturePicker. "Best Observability Tools for Small Teams in 2026 (Budget...".
https://futurepicker.com/en/observability-tools-small-teams-2026-2/
Note: Standards and tool pricing may be updated; please check the latest official documentation or consult professional advisors before making tooling decisions.